At a Glance
- The carbon footprint of plastic covers its full life cycle, from production to disposal.
- PP and PE emit less CO₂e than PET; bioplastics aren’t always greener.
- Plastic often beats glass and paper in carbon impact due to light weight.
- Scope 3 emissions are big — better recycling helps reduce them.
Imagine holding a plastic food container. Invisible to your eye, it carries a story written in carbon molecules. The carbon footprint of plastic food packaging is like a detective novel. It reveals surprising twists and challenges in what we think we know. Understanding a carbon footprint requires tracking every emission. This covers everything from extracting raw materials to disposing of products. These emissions are measured in CO₂ equivalents.
Breaking the carbon code gives food industry experts an advantage. It helps them save money and prove their commitment to sustainability.
This week, we sat down with Conor Carlin, Founder & President of Clefs Advisory LLC. Working where packaging meets sustainability, Conor was the 2024 President of the Society of Plastics Engineers and previously served as former General Manager for ILLIG in North America. He brings valuable expertise in materials, packaging technologies, policy development, commercial strategy, and market intelligence to the industry.
Ready to become a carbon footprint sleuth? Let’s check out the interesting science behind smart packaging in today’s food industry.
What Exactly Is a Carbon Footprint?
 Before we get into the ‘nitty-gritty,’ let’s define what exactly we’re talking about. A carbon footprint measures the total greenhouse gases (GHGs) emitted during the life of a product or service.
Emissions are converted into CO₂ equivalents (CO₂e), which allows for the comparison of different materials and processes.
This standardization matters because not all greenhouse gases have an equal impact. Methane, the gas commonly known from cattle farming, has a global warming potential 18-25 times higher than carbon dioxide. Converting everything to CO₂e helps us see the real environmental impact of various packaging choices.
The Life Cycle Approach to Plastic Packaging
To understand its carbon footprint, we need to look at the full life cycle of plastic packaging. This is done using a Life Cycle Assessment (LCA). These assessments track the environmental effects from resource extraction (“cradle”) to the factory gate or disposal at the end of life (“grave”).
For plastic food packaging, carbon footprint aspects usually cover (get ready for some tricky chemical terms):
Cradle phase (raw material extraction and processing): For fossil-based plastics like polyethylene terephthalate (PET), polypropylene (PP), polystyrene (PS), and polyethylene (PE), the majority of carbon emissions come from this initial phase. Oil and gas extraction, refining, and polymerization use a lot of energy, creating a big carbon footprint even before the packaging is made.
Manufacturing phase: The process of converting plastic resins into food packaging adds to the carbon footprint. This phase covers energy for melting and shaping plastics. It also incorporates energy and water resources to run production facilities.
Distribution phase: Here’s where plastic often outperforms alternatives. Because it’s lightweight, it consumes less fuel during transport. This leads to a smaller carbon footprint per unit compared to heavier materials like glass, metal, or paper.
End-of-life phase: What happens after use also impacts plastic’s overall carbon footprint. Plastics in landfills waste valuable resources and may produce methane depending on the type of landfill. In some cases, landfills are designed to capture methane, otherwise known as natural gas, which can be re-used. Incinerating them releases carbon dioxide and potentially other gases. Recycling substantially reduces the overall footprint, but only when systems function efficiently.
Different Plastics, Different Footprints
Not all plastic food packaging carries the same carbon burden. Industry data shows that PET’s carbon footprint varies. It can range from 1.5 to 3.6 kg CO₂e for every kilogram, or 3.3 to 7.9 lb CO₂e per pound. This difference depends on the manufacturing methods and energy sources used.
 Polyolefins, or types of plastics made from simple molecules called olefins and are derived from petroleum, like PP and PE, usually have a lower carbon footprint than PET. This is because they have simpler polymerization processes (a chemical process where small molecules called monomers join together to form long chains known as polymers) and lower density. This explains why lightweight PP packaging often outperforms alternatives in LCA studies. What can we say? PP really likes to have a good report card!
Bioplastics present a different carbon profile altogether. Materials such as polylactic acid (PLA) come from renewable sources like corn or sugarcane. This can help reduce the use of fossil-based resources in the production of some plastics. However, their carbon footprint largely comes from agricultural factors:
- Land use changes
- Fertilizer application and production
- Irrigation water usage
- Processing heat requirements
Interestingly, bioplastics don’t always outperform traditional plastics in carbon footprint assessments. Some studies show that PP has a lower carbon impact than PLA in some cases, like coffee capsules. This is mainly because PP is lighter and easier to make. Again, high fives all around for PP!
How Plastic Compares to Alternative Materials
The carbon footprint of plastic food packaging can be surprising when compared with glass, aluminum, or paper. A 2016 TruCost study found that replacing plastic packaging with other materials could increase CO₂e emissions by about four times.
This counterintuitive finding stems from plastic’s efficiency advantages:
- Lightweight nature reduces transportation emissions
- Less energy-intensive manufacturing compared to alternatives like glass or aluminum
These advantages result in what experts refer to as “plastic’s environmental paradox.” Some less (perceived) green materials may produce lower carbon footprints in food packaging.
Beyond Production: Carbon Impacts Across the Value Chain
The full carbon story of plastic food packaging extends beyond manufacturing. For food industry professionals, understanding these additional factors is crucial.
Scope 1, 2, and 3 Emissions
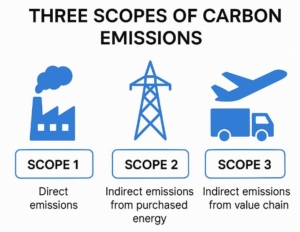
Companies track carbon footprints using three scopes:
Scope 1: Direct emissions from owned or controlled sources (like on-site fuel combustion). Examples of this include:
- Company-owned vehicles: Emissions from fuel combustion in company-owned cars, trucks, buses, and other vehicles used for transportation
- Stationary combustion sources: Emissions from burning fuels in stationary equipment such as boilers, furnaces, generators, and turbines at company facilities
- Industrial processes: Emissions from chemical reactions during manufacturing processes, such as cement production or steelmaking
- Fugitive emissions: Unintentional releases of gases from equipment, such as refrigerant leaks from air conditioning systems or methane leaks from pipelines.
Scope 2: Indirect emissions from purchased electricity or energy. You have got to run the plants somehow!
Scope 3: All other indirect emissions throughout the value chain. Think of employees driving their cars to work every day.
For most food packaging companies, Scope 3 emissions are a big deal. They include things like supplier activities, transportation, and end-of-life disposal. These emissions make up the largest part of their carbon footprint. However, they are also the hardest to measure and control. This is due to the following reasons:
- Indirect nature: Scope 3 emissions come from sources that are not directly owned or controlled by the company, such as suppliers, transportation, and product disposal. This makes it challenging to gather accurate data.
- Complex supply chains: Many companies have extensive and complex supply chains involving numerous suppliers and sub-suppliers. Tracking emissions across all these levels can be extremely difficult.
- Data quality and availability: Often, the data needed to measure Scope 3 emissions is either not available or of poor quality. Smaller suppliers may not have the resources or expertise to provide accurate emissions data.
- Evolving standards: The standards and methods for measuring and reporting Scope 3 emissions are constantly evolving, making it hard for companies to keep up and ensure consistency.

Recycled Content Benefits
Incorporating recycled plastic can significantly reduce carbon footprints. This is largely due to the energy-intensive processes involved in extracting and refining raw fossil fuels for virgin plastic production — steps that rPET avoids entirely. By reusing existing plastic, rPET can reduce greenhouse gas emissions by up to 60% and support a circular economy by keeping plastic out of landfills and oceans. It’s a more sustainable, lower-impact choice for packaging.
However, despite these clear environmental benefits, challenges remain. One major issue is the limited availability and inconsistent quality of recycled content suitable for food-contact applications, which are subject to strict safety and regulatory requirements. This shortage can limit how widely rPET can be used in certain packaging sectors, creating a bottleneck for companies seeking to improve their sustainability profiles.
Addressing these challenges requires industry-wide collaboration: improving recycling infrastructure, investing in better sorting and cleaning technologies, and creating stronger demand signals for high-quality recycled materials. Only by tackling these systemic barriers can we fully unlock the potential of rPET and drive the packaging industry toward a more circular, low-carbon future.
Why This Matters for Food Industry Professionals
Understanding the carbon footprint of plastic packaging is vital. It’s important for the environment and essential for business in the following ways:
Consumer expectations: Today’s consumers increasingly factor environmental impact into purchasing decisions. Accurate carbon footprint information allows for transparent communication about packaging choices.
Regulatory compliance: Various areas are starting to use laws and “carbon pricing” for extended producer responsibility. “Carbon pricing” is a method used to charge companies for the greenhouse gas emissions they produce. This can be done through mechanisms like carbon taxes or Emissions Trading Systems (ETS). The idea is to make companies pay for the environmental damage caused by their emissions, thereby encouraging them to reduce their footprint.
Future-proofing your business: Companies that know and manage their packaging carbon footprints can better handle growing environmental rules and shifting market needs.
Making Informed Decisions
 Food industry pros wanting to reduce the carbon footprint of plastic packaging can try these tips:
- Look at the full picture: Lightweight plastic may have a bigger production impact but often leads to lower transportation emissions than other materials.
- Choose packaging wisely: The best option reduces a carbon footprint and also protects food. It ensures safety and maintains shelf life. Wasted food significantly increases carbon emissions. This is because when food is thrown away, all the resources used to produce it — like water, energy, and fuel — are wasted too. In landfills, food breaks down and releases methane, a powerful greenhouse gas.
- Support system improvements: Push for uniform recycling systems. Also, think about using more recycled materials in food-grade packaging. Just note that increased recycled content can affect the clarity of the packaging and have an impact on the appearance and appeal of your food.
Using Your Carbon Footprint Knowledge
Understanding the carbon footprint of plastic food packaging helps us make smart choices. It allows us to weigh environmental effects against performance needs. When food industry experts grasp this topic, they can select packaging that supports their business and the planet.
Your best solution matters most to Inline Plastics — even if that means recommending options outside our services. Reach out anytime with questions. We’re here to guide you.
Would you like to know more about Conor Carlin and his work at Clefs Advisory LLC? Connect with him on LinkedIn today.